Bettina is a skilled, enthusiastic, results-driven Principal UX Product Designer based in Amsterdam, The Netherlands. With over two decades experience in strategic design, product design, enterprise UX, enterprise AI, and data products, she brings a unique perspective and empathy to user-centric designs and innovations.

Work

Product Innovation

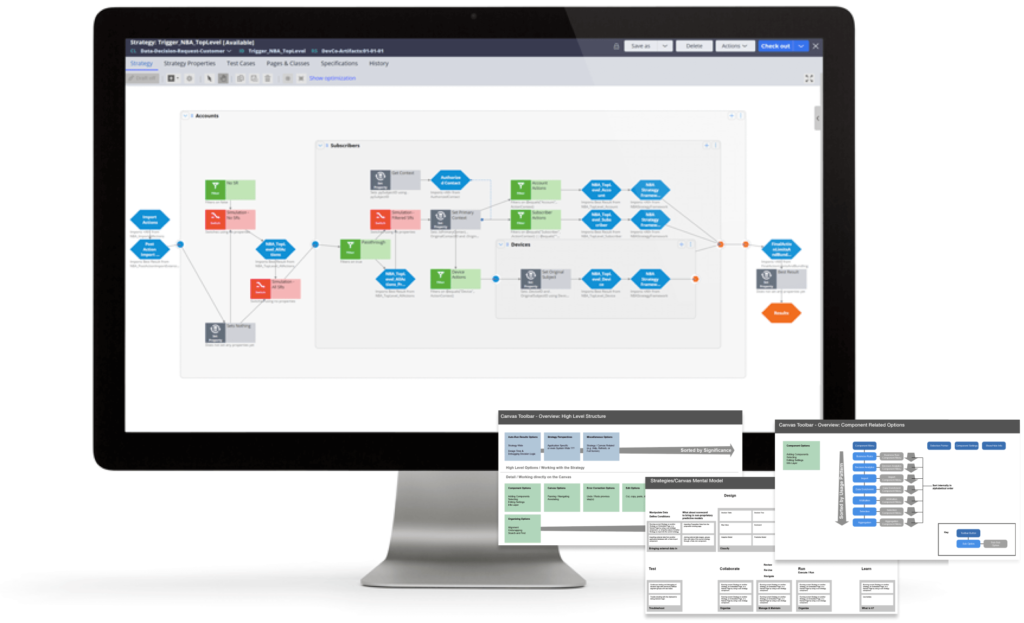
Automating decisions on enterprise scale

A canvas-based low-code AI editor that enables business users to design meaningful, hyper-personalized 1:1 omni-channel customer engagements, that can perform millions of decisions.

See project summary ↗

A monitor showcasing a colorful diagram of a decision strategy. The image of the monitor is overlapped with screenshots of process steps.

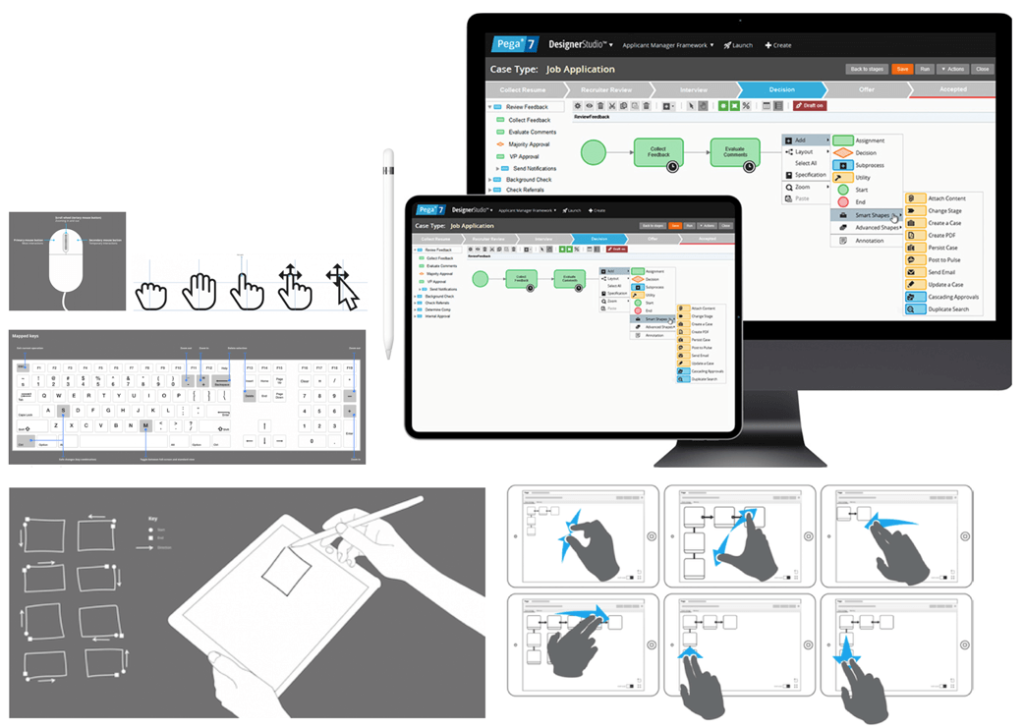
Empowering users with visual programming

A high performant graphical framework that powers canvas-based low-code environments used to model ETL operations, business processes, decision and event detection logic.

See project summary ↗

A collage made up of a monitor and an apple iPad showcasing a process flow. The two devices are surrounded by various modes of interactions showing gestural input on touch screens using finger gestures, input using an Apple pen, a keyboard with keyboard shortcuts, a mouse and the various states of mouse cursors communicating interaction types.

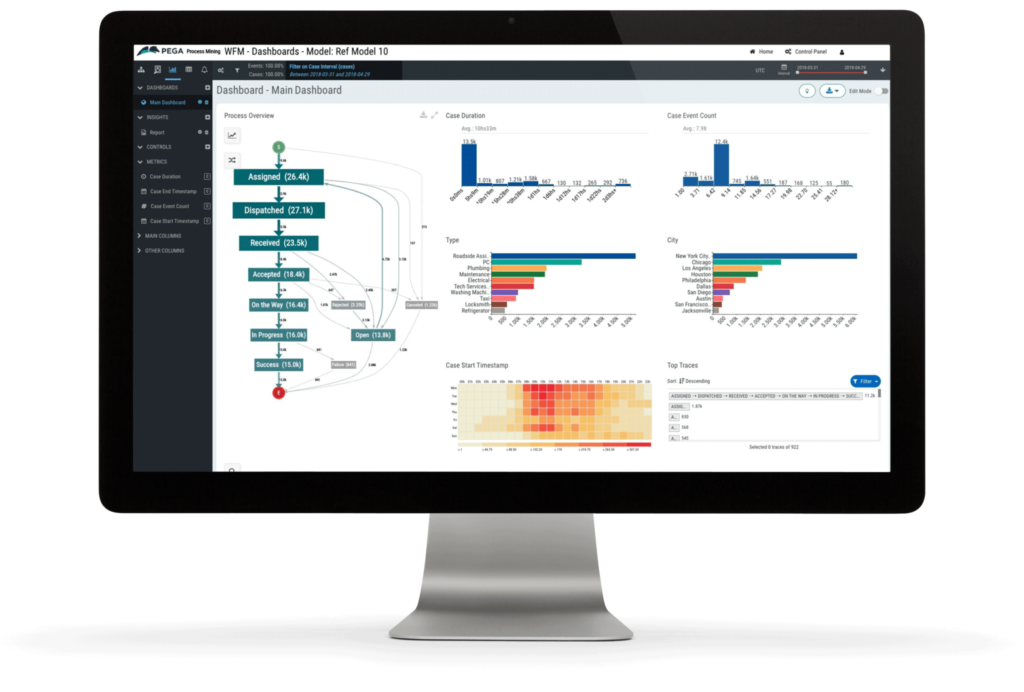
Optimizing operational processes

A tool that enables organizations to gain a deeper understanding of their operational processes and make data-driven decisions to improve efficiency and effectiveness.

See project summary ↗

A monitor showing a dashboard with bar, and column diagrams, a heatmap and a sankey chart to make the paths in process flows visible.

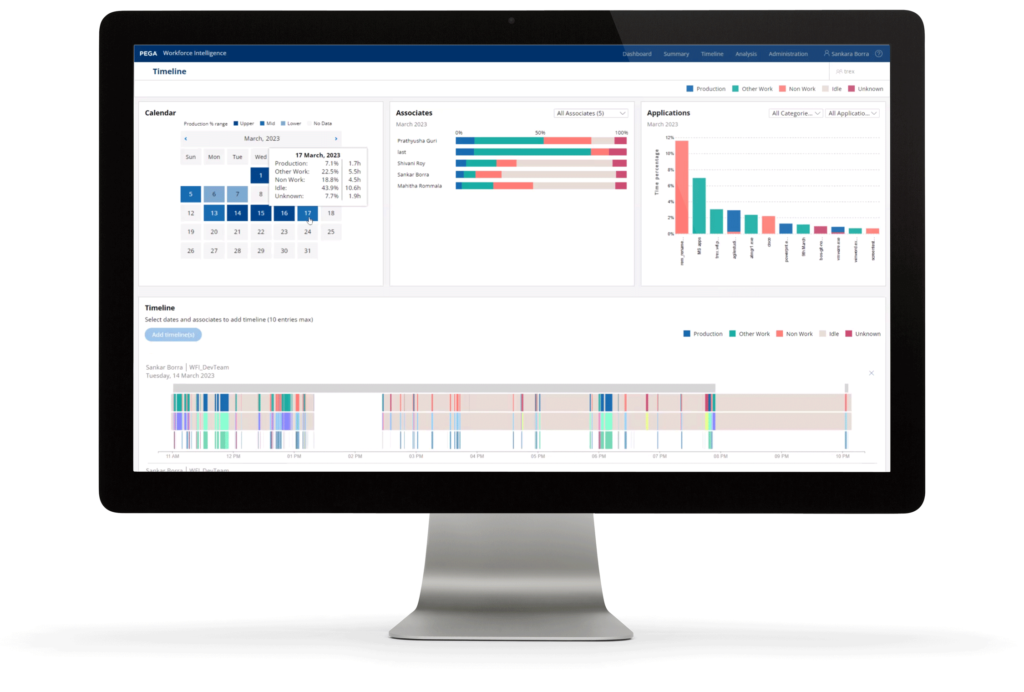
Managing a workforce

An analytics solution that brings minute-accurate transparency to where employees spend time on, enabling organizations to uncover opportunities for improving integration of tools, and optimizing workflows.
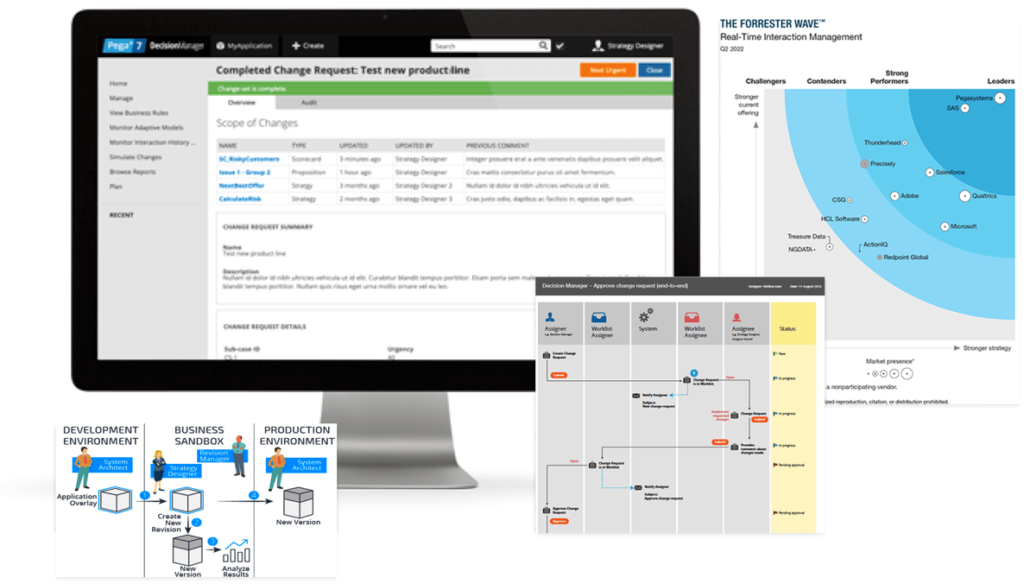
See project summary ↗

A monitor showcasing a dashboard used for workforce analysis. It shows a calendar view, and various categories displayed in bar and column charts. In the bottom is a timeline showcasing where employees needed to switch screens.

Managing change

A business-friendly environment where non-technical users can safely– and with little involvement from IT – make changes to their business logic and simulate the impacts of changes before deploying them into production.

See project summary ↗

A collage consisting of a monitor showcasing an enterprise application used to manage change requests. Next to it are images that explain the modes of interaction, in a detailed and high level view. There is also an image showcasing the leading position of the product in Forrester Wave.

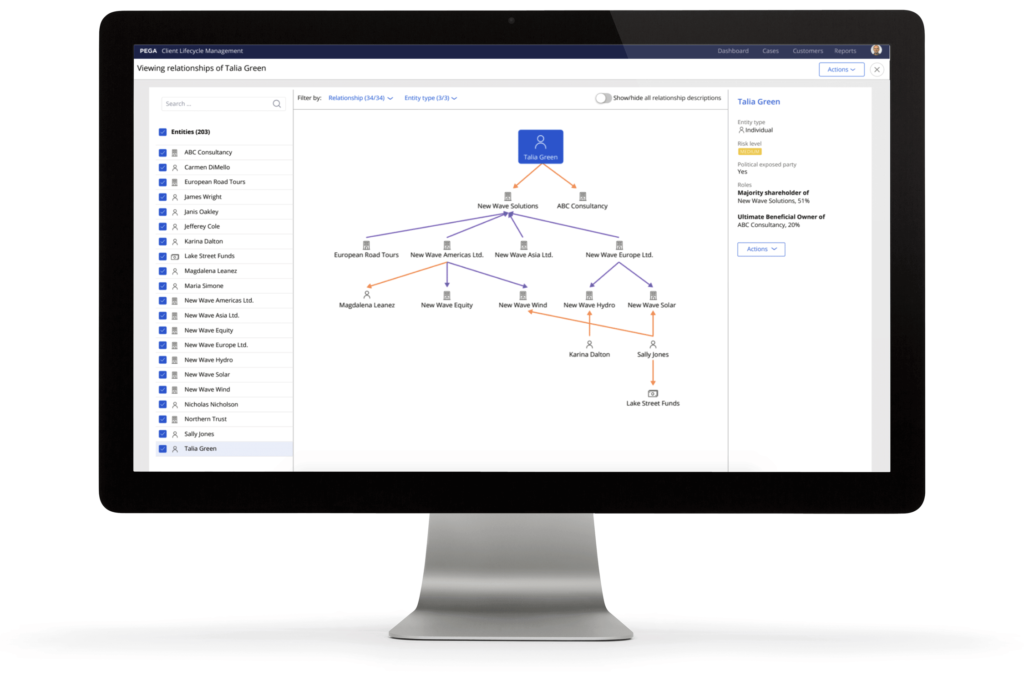
Making relationships and influence visible

A lifecycle management and KYC application that presents all related parties associated for onboarding, risk assessment, compliance status, and more.

See project summary ↗

A monitor showcasing an enterprise application used for onboarding. The screen shows a hierarchical network diagram.

Research Projects

A collage showcasing a monitor displaying the default screen of an enterprise application which is overlapped by a heatmap. Surrounding the monitor is a worldmap with pins, a flow diagram with drop-off rates, two spreadsheets and a matrix all comparing results.

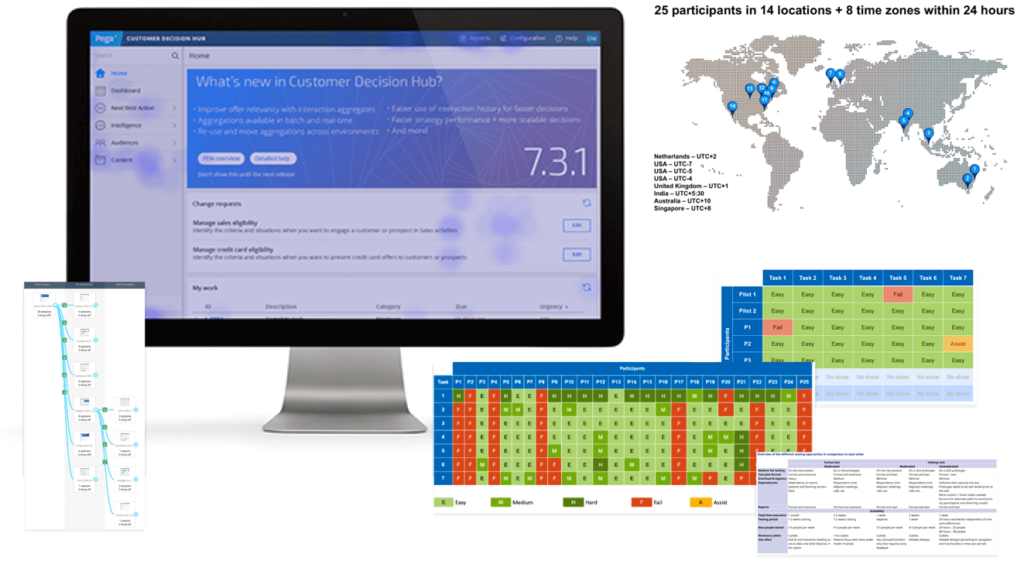
Scaling usability testing

A pilot study to evaluate how to repeatedly increase speed, velocity, scalability, and effectiveness of usability testing methods for complex enterprise software systems.

See project summary ↗

A collage showing illustrations of different types of disabilities next to a collection of images simulating the severity and stages of decreasing vision in a variety of health conditions that impact the ability to see negatively.

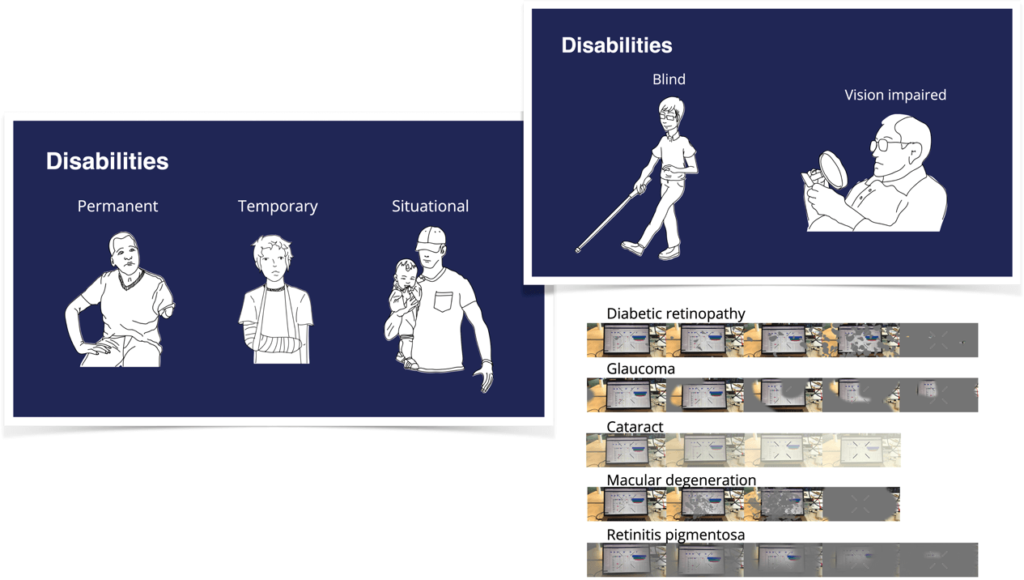
Increasing awareness of inclusive design

A presentation to educate stakeholders and other employees about the importance of accessibility for all product areas by promoting inclusive design, and why it matters.

See project summary ↗

An image of a laptop monitor repeated four times showcasing the same dashboard. In each image another type of color blindness is simulated. Next to it is a continuous color palette as perceived by people with standard vision, and repeated four times in the different types of color blindness.

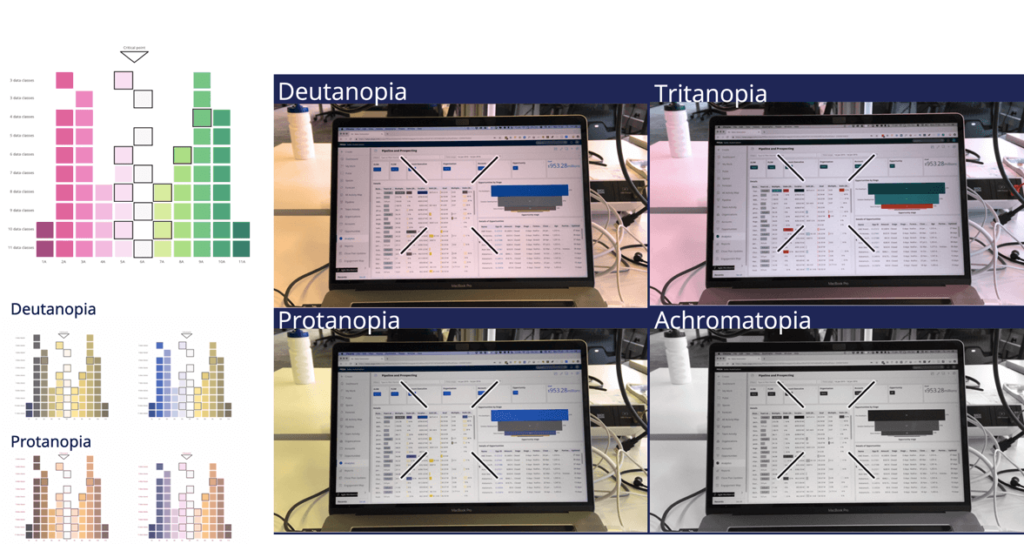
Accessible data visualization

A set of “standard” visualization methods and color palettes that make data visualizations look like the Pega brand, while at the same time being accessible.

See project summary ↗

A collection of photos showing people collaborating during a workshop, organizing papers and a final process with its sub steps.

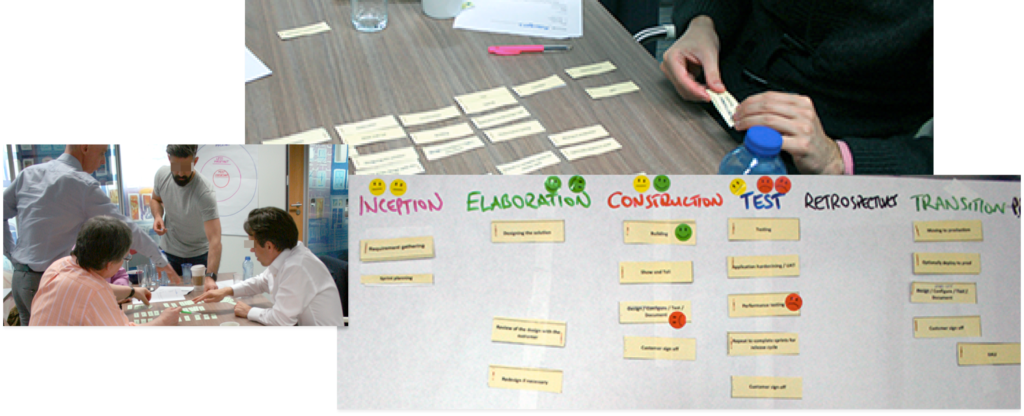
Defining decision architects

Workshop about uncovering pain points and potential more insights about the workflows of the specialized and technical user audience “Decision Architects”.

See project summary ↗